DECK
Keep reading
Want more information? Check out Slideshare for more details and the full story behind this case study.
Read more
Case study
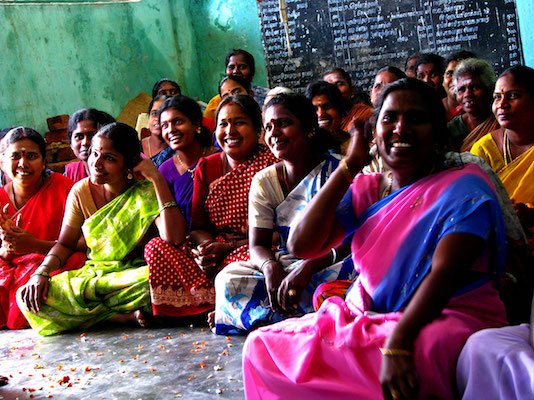
M.P. Kesineni Srinivas, the Tata Trusts, and SocialCops partnered to create model villages throughout Vijayawada. To do this, we collected data from over 250,000 households in just 90 days, then helped officials use that data to target and plan their programs more effectively.

Tata Trusts
Kesineni Srinivas
Minister of Parliament, Vijayawada

Government of Andhra Pradesh

Centre for People's Forestry
Government
Philanthropy
Nonprofit
The Saansad Adarsh Gram Yojana, a rural development program launched in October 2014, requires that every Minister of Parliament choose one village from their constituency and turn it into a model village by 2016.
Instead of choosing just one village, Mr. Kesineni Srinivas (MP of Vijayawada in Andhra Pradesh) partnered with the Tata Trusts and SocialCops to transform each of the 264 villages in his constituency. This joint program aimed to build a micro-targeted development plan for every individual, household, and village in Vijayawada in just 90 days.
The Tata Trusts partnered with SocialCops to help all levels of district officials plan for better budget and policy decisions in Vijayawada. Our data intelligence platform was deployed to create a centralized planning tool for the constituency that would be used to effectively micro-target development initiatives.
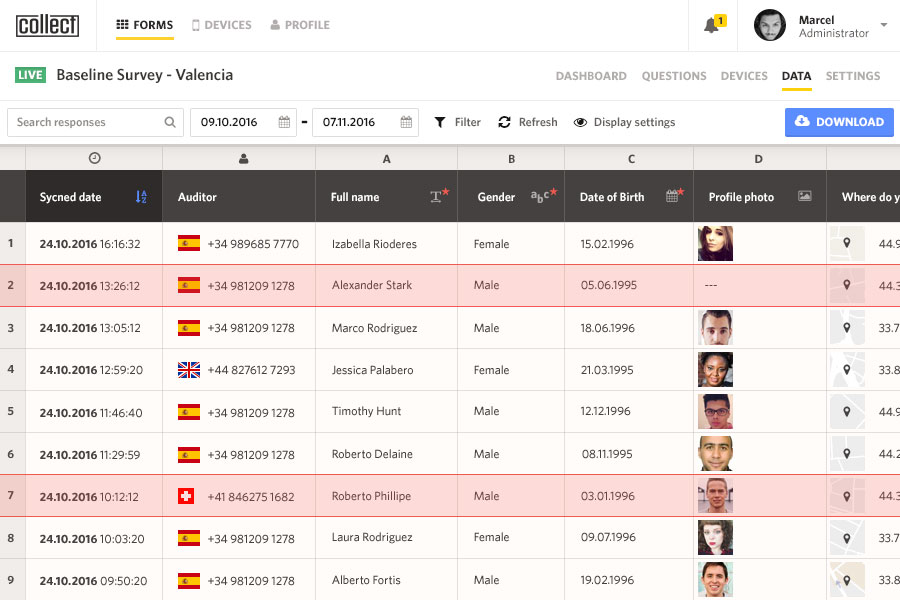
Our mobile data collection app was used to collect and map data for each household and each village’s infrastructure, healthcare facilities, schools, and more. Each of the 8 baseline surveys ranged from 76 to 117 questions.
Every day, 5 to 10 thousand survey responses — with a total of 1.5 million data points — came in from the field. This data was cleaned, verified, and structured to build aggregate village profiles, development indices, and priority scores.
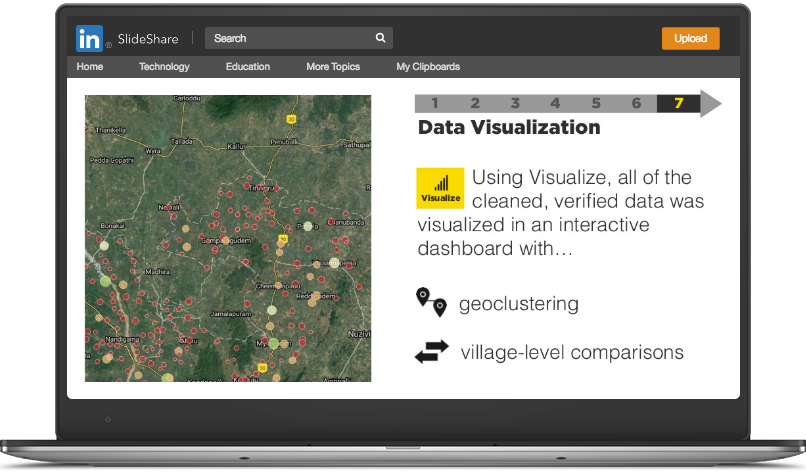
The transformed data was visualized in two interactive dashboards with geoclustering, village-level comparisons, household-level views, village profiles, and intelligent querying tools.
One important player in creating a data-centric culture in government is the technology partner. That's the role SocialCops has been playing, and it's a relationship we value a lot.
Senior Programme Manager
Tata TrustsQuestionnaire creation
Our data scientists created 6 household and village surveys with built-in validations to improve data quality.
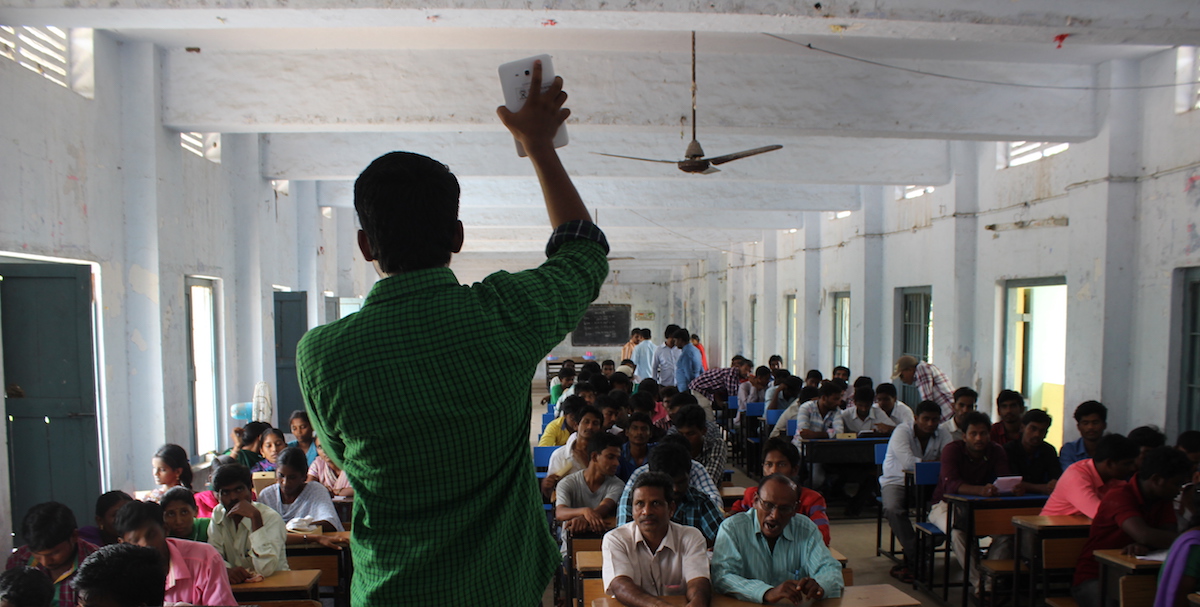
Surveyor training
We trained 1,200 volunteers from our partner organization on how to use a tablet and collect data.
Data collection
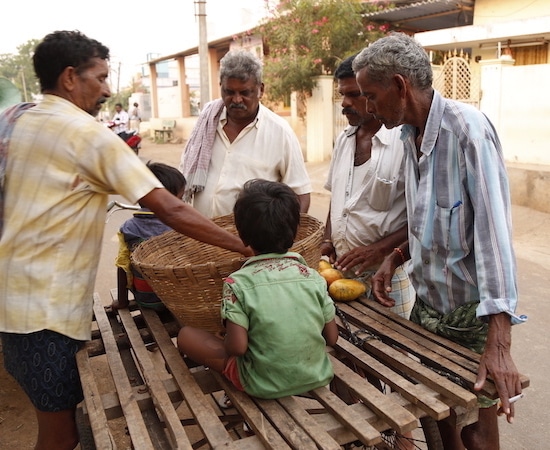
Volunteers collected 150 data points from every household in Vijayawada — a total of 264 villages in 90 days.
Data flagging
As data was collected, it was automatically verified and bad data was flagged for re-collection.
Data analysis
Our data scientists processed, cleaned, and analyzed all the data to create village scorecards.
Data visualization
Data was visualized on two interactive dashboards with village profiles, geoclustering, and more.
Many parts of Vijayawada do not have mobile or internet service. Data was saved to tablets’ local storage, then synced when internet was available.
Every household was geotagged on a map using GPS, even without internet. Surveyors also used Collect to map village health centers, schools, and more.
Every survey was automatically customized with the most relevant questions for the person being surveyed. This saved crucial time on every survey.
Many surveyors only spoke Telugu, so the entire Collect app — including action buttons and instructions — was converted to Telugu.
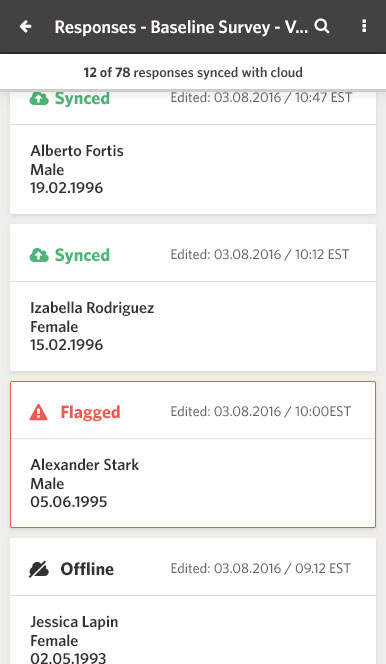
As data was collected, it was automatically verified on Transform. Any data point that fell outside of pre-set parameters or was inconsistent was automatically flagged on Collect. Then surveyors can immediately return to check and re-collect that data point in the field.
Consistency checks
Includes intra-variable (checking each variable for incorrect values) and inter-variable checks (ensuring that data is consistent across variables).
Village scorecard creation
Data was aggregated to score the development of each village, based on various individual, economic, health, and infrastructure development indicators.
Schemes matching
By matching eligibility data for each scheme with each person's data, Transform determined when people were not using schemes that they were eligible for.
Mapping made it easy to find hidden patterns, such as the link between distance to the river and toilet use.
Decision makers could create queries like “villages with no bus stations and population > 5,000 people”.
All the data — healthcare, education, infrastructure and more — that officials need was available through interactive charts.
We matched scheme eligibility data with individual data, so officials could understand how scheme eligibility varied.
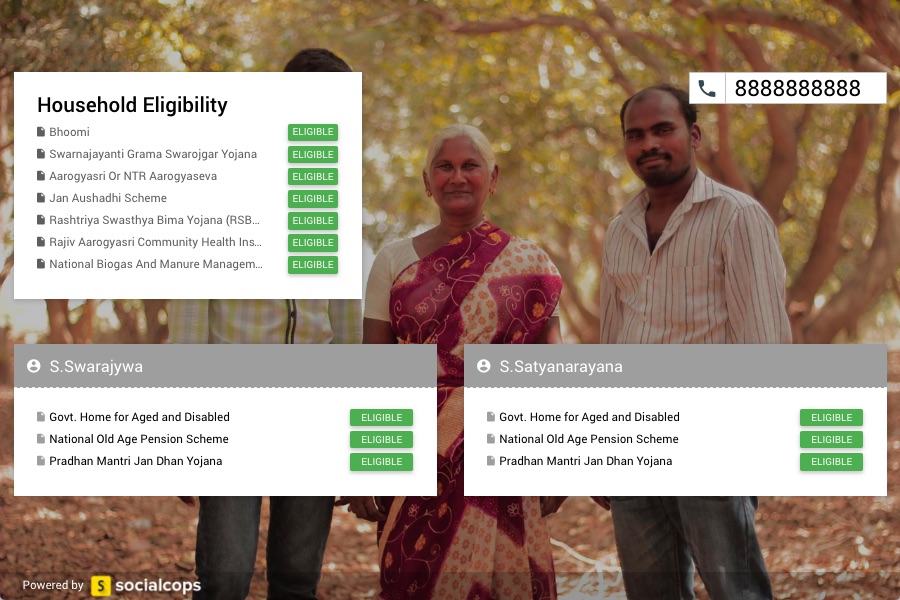
By matching eligibility data for each scheme with each person's data, we could determine when someone was not using schemes for which they were eligible. Local administrators used this dashboard to help people get the schemes they were eligible for.

With the launch of these 264 Village Development Plans for Vijayawada Parliamentary Constituency, we have redefined participative democracy and given our citizens real say in development. In this unprecedented effort, over 1 million people were mobilised for the creation of development plans. What we have achieved today is a big step in our mission to make Vijayawada a model constituency.
DECK
Want more information? Check out Slideshare for more details and the full story behind this case study.
Read more