Case study

Case study
As part of the Ujjwala Yojana scheme, the Ministry of Petroleum and Natural Gas gave out 20 million new LPG connections in just 11 months. They partnered with SocialCops to track each new installation and ensure that each new cylinder is installed safely.

Ministry of Petroleum and Natural Gas

Bharat Gas

Indian Oil

Hindustan Petroleum
Government
Business
India
In May 2016, the Ministry of Petroleum and Natural Gas launched Pradhan Mantri Ujjwala Yojana, its flagship scheme to ensure access to clean cooking fuel. The scheme aims to provide free LPG (liquified petroleum gas) connections to 50 million women under the poverty line by 2019.
The Ministry of Petroleum and Natural Gas partnered with SocialCops to use data intelligence to carry out the scheme effectively. We focused on three aspects of the scheme; after figuring out where to open new centers and tracking the LPG application process, we set out to ensure that new LPG connections were installed safely.
Learn more
Poverty sees no barrier of caste, creed or religion... We ensured that the PM Ujjwala Yojana also remains above these barriers.
Union Minister, Ministry of Petroleum and Natural Gas
Government of IndiaIn its first 11 months, the Ujjwala Yojana scheme gave out 20 million new LPG connections. However, since all these connections were given to people who had never used LPG cylinders before, it was important to ensure they were installed safely. For example, the stove should ideally be away from flammable objects, above the height of the cylinder, and placed on a stone — not wood — surface.
To check if new connections were being installed safely, every distribution center equipped its mechanics with our data collection app.
As each LPG application was approved, the applicant's data was automatically pulled from the oil marketing companies' databases and loaded into Collect, our data collection tool. Then, when a mechanic went to install each new connection, they used Collect to access the applicant's data and collect photos and data about how the new connection was installed.

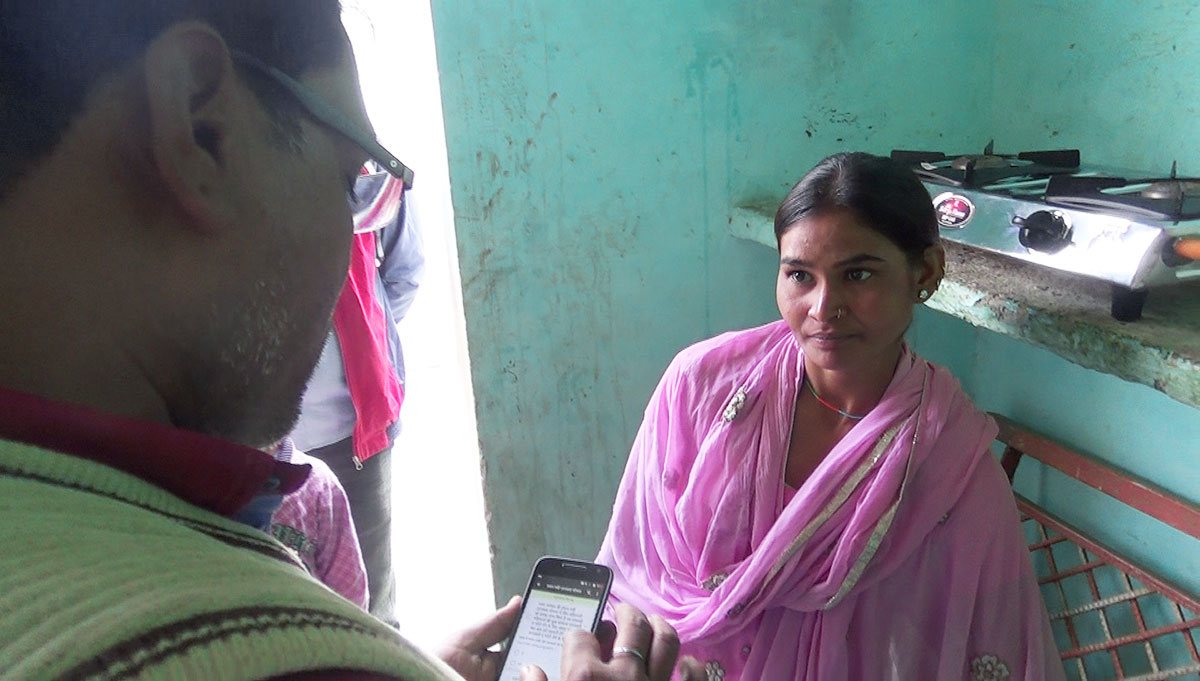
While installing every new LPG connection, mechanics use our data collection tool to collect before and after photos plus other data verifying that the installation was installed.

Our data transformation engine automatically pulls, cleans, and aggregates the data about every approved application and the data collected by mechanics in real time.

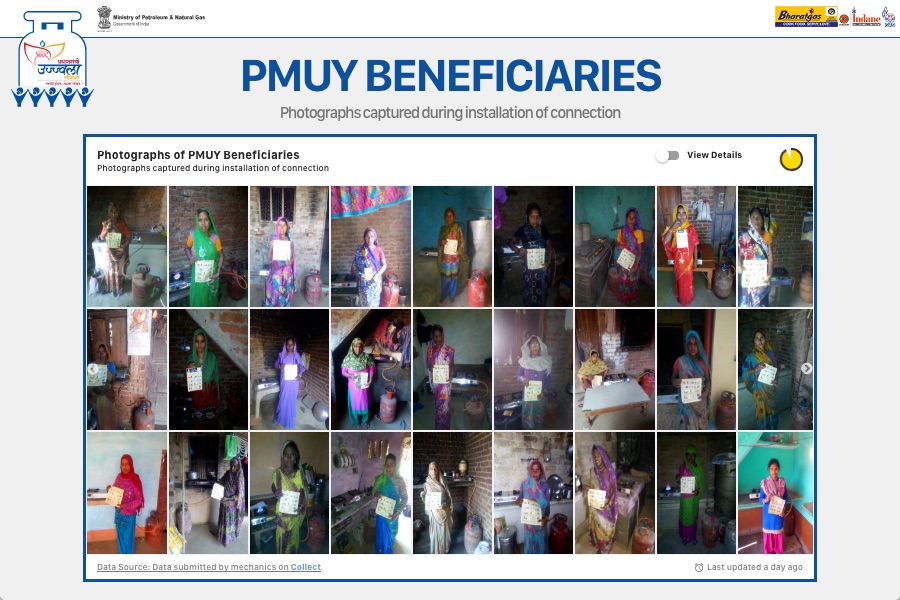
As each new connection is installed, its photo appears on a real-time dashboard to make it easier for officials to proactively identify and address unsafe installations.
[It's a] matter of immense pride and joy that the number of beneficiaries of PM Ujjwala Yojna has crossed 2 crore in less than a year!

Prime Minister
Government of IndiaTraining distributors and mechanics
The first step was training thousands of mechanics across India. We trained trainers and officers to build their knowledge about accurate data collection.
Data collection
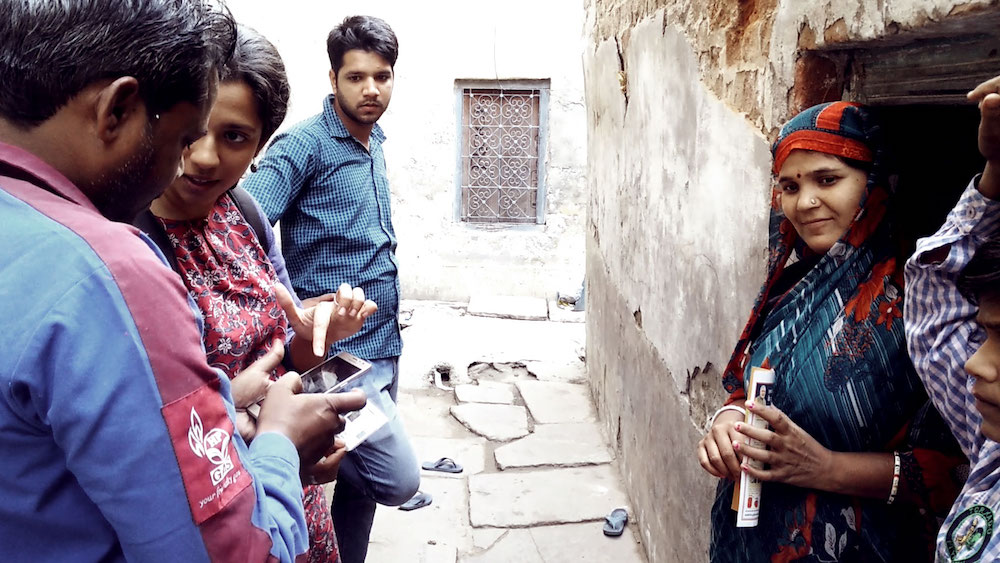
Every day, mechanics across the country — often in rural, remote areas without connection — collected thousands of data points on every new LPG connection.
Data visualization
We aggregated photos of all new connections in a single real-time dashboard, where officials could quickly spot and deal with problems.
LPG mechanics were often first-time smartphone users, but they had no trouble with Collect. The intuitive UI/UX made training thousands of people a breeze.
Rural India often does not have mobile or internet service. Data was saved to phones' local storage, then synced when internet was available.
The media features in Collect help mechanics capture photos before and after installation of every new LPG cylinder.
The entire Collect app — including action buttons and instructions — could be changed from Hindi to local languages in a single click.

Every photo of an installed connection is immediately pulled into our real-time dashboard. Ministers and officials use this dashboard to quickly spot safety issues.
For example, whenever officials see a cylinder installed unsafely — on a wood surface, underneath a straw roof, etc. — they immediately send surveyors back to move the cylinder.
The dashboard was also helpful for identifying bad data. For example, officials initially saw photos of tables or fields — sent by mechanics who weren't installing their assigned connections. Ministers immediately called those distribution centers and reprimanded them. Real photos quickly started showing up from those centers.