FREE ONLINE COURSE

Introduction to GIS

Introduction to GIS

Manipulating and Mapping Geospatial Data in R

Manipulating and Mapping Geospatial Data in R
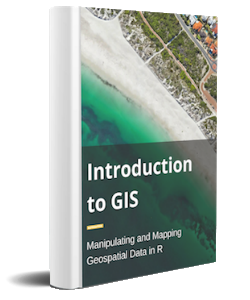
introduction to gis in r course

This online course will give you a complete introduction to processing, analyzing & mapping geospatial data in R.

  • Course completion certificate

  • Downloadable PDF version of course

  • Step-by-step demos using sample data

  • 100+ useful R code snippets

  • 50+ sample maps

Learn anytime, anywhere

This text- and code-based course is self-paced. Come and go as you like, for as long as you like, and learn whenever fits your busy schedule.

Download course PDFs

Don't want to take this course online? Prefer reading offline? You can view and download the entire course or individual lessons as PDFs.

Get completion certificate

When you're all done, request a completion certificate. Once we've verified that you completed the course, we'll email it to you.

This course includes 6 lessons that will help you start using geospatial data in R today.

1

Use Cases of Geospatial Data

In this lesson, you'll learn how geospatial data is being used today across sectors to segment markets, prevent fraud, identify vulnerable populations, and more.

2

Manipulating Geospatial Data in R

This lesson starts with the basics of why and how to use R as a GIS. Next, you'll walk through fundamental geospatial operations using Indian economic data.

3

Creating Static Maps in R

This lesson introduces 3 different R packages for creating 7 types of static geospatial maps: choropleth, inset, faceted, geofaceted, cartogram, bubble and hexabin.

4

Creating Animated and Interactive Maps in R

This lesson walks you through 7 different R packages for building animated and interactive maps, plus an overview of how to build geospatial web applications with Shiny.

5

Performing Spatial Subsetting in R

Spatial subsetting helps you tap into the actual geometry of geospatial data. This lesson explains how to filter regions based on how they relate to other regions in your data (such as distance or intersections).

6

Exploring Raster Images in R

Raster (or satellite) data is a complex form of geospatial data. This lesson explains where to get raster images, and how to extract and process them, do basic operations and analysis, build indices on them, and more.

Thousands of people from the world's leading universities, businesses, and nonprofits have already signed up for this course.
Google logo
MIT logo
Nielsen logo
Columbia University logo
BBC World Service logo
Lund University logo
HSBC logo
IBM logo
Gartner logo
WWF logo
University of Chicago logo
USAID logo
World Food Programme logo
Economist Intelligence Unit logo
McKinsey logo
National University of Singapore logo

More resources to help you get started with geospatial data