VIDEO DEMO
See it in action
Want to learn more or see this dashboard in action? Check out our 5-minute video demo, where we walk through all major aspects of the case study and dashboard.
Watch the video demo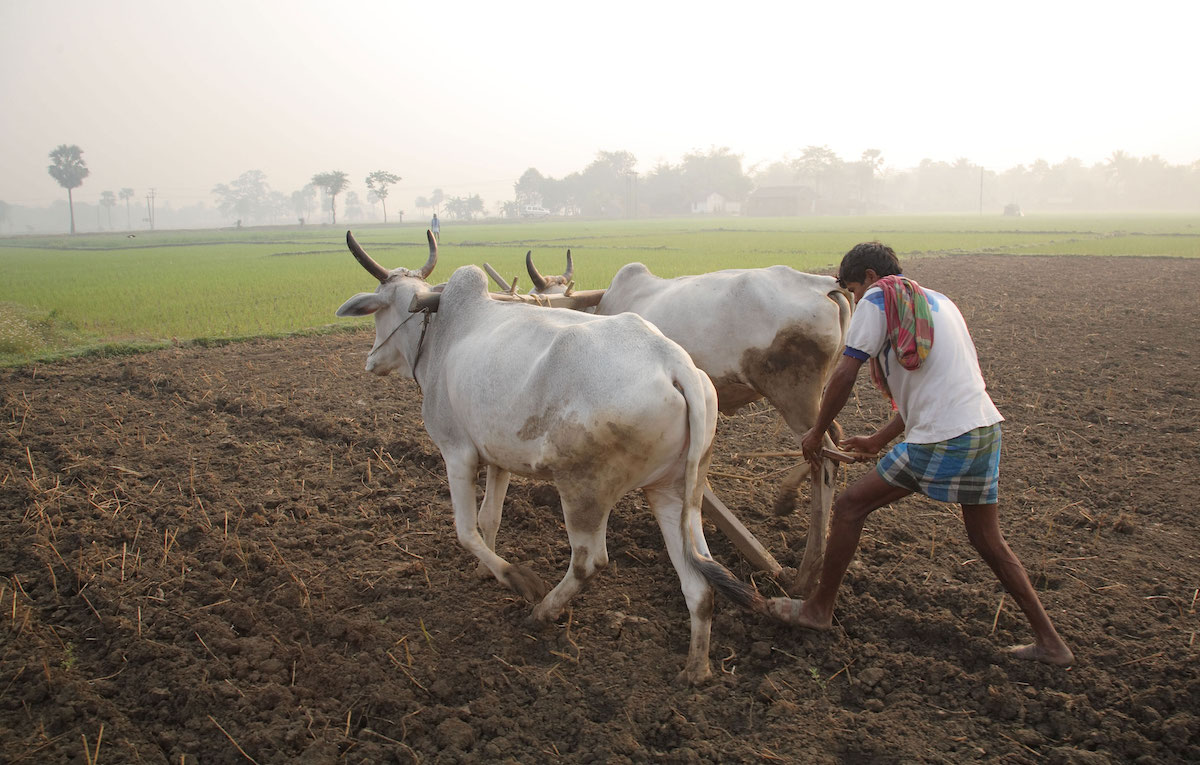
Case study
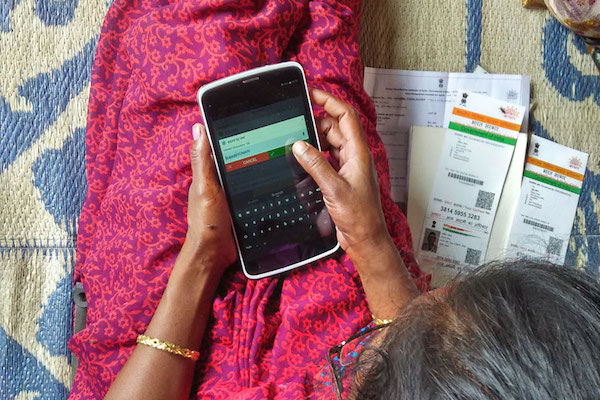
The Bill and Melinda Gates Foundation decided to invest $8 million in initiatives for small and marginal farmers in India. They partnered with SocialCops to effectively target this investment using data intelligence.

Bill & Melinda Gates Foundation
Philanthropy
Bihar Odisha Uttar Pradesh India
The Bill & Melinda Gates Foundation, the largest private foundation in the world, created an $8 million fund to aid small and marginal farmers in Bihar, Odisha, and Uttar Pradesh in India.
They wanted to use data to identify where they should invest to maximize their impact and focus on internal priorities (female empowerment, agricultural extension, nutrition, and more). However, agriculture data for India is scattered, inconsistent, and difficult to work with.
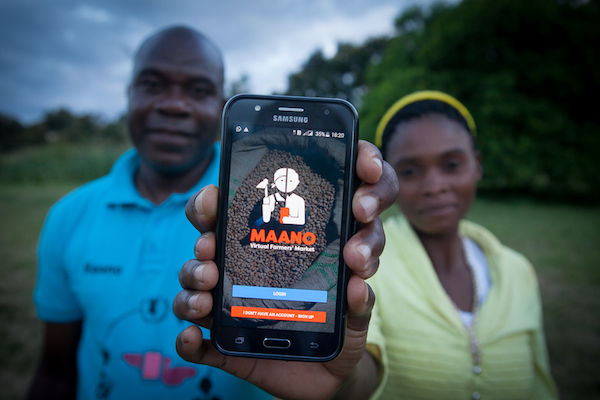
The Gates Foundation partnered with SocialCops to create a data-driven way for teams at the Gates Foundation to target their investments. Our platform was deployed to aggregate data from public sources, clean and structure the data, and visualize the data in an intuitive, useful dashboard.
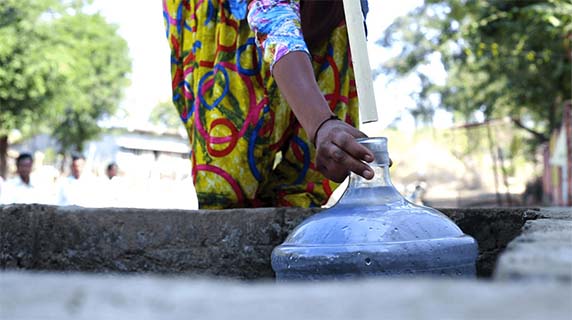
Data from 31 different public data sources — including difficult data on crop productivity, access to irrigation facilities, local infrastructure, soil conditions, and more — was sourced from our data repository.
The data was matched and aggregated in a single data set with our entity recognition engine, which recognizes and corrects errors and inconsistencies. The data set was then transformed into district-level indices on economic situation, crop productivity, female empowerment, nutrition, and more.
The data and indices were visualized on an interactive dashboard with geo-clustering, district-level comparisons, advanced geographic queries, and detailed drill downs.
Before we bridge the development gap, we needed to bridge the data gap.

Co-Chair
Bill & Melinda Gates FoundationData aggregation
Data from 31 sources was compiled, covering 209 indicators in 9 layers (agricultural profile, crop productivity, nutrition, etc).
Data cleaning and score creation
Our data scientists cleaned and verified all the data, then converted each layer's data into a single score for easier comparison across districts.
Data visualization
Data was visualized on an interactive dashboard with state-level views, district comparisons, an intelligent query engine, and access to raw data.
VIDEO DEMO
Want to learn more or see this dashboard in action? Check out our 5-minute video demo, where we walk through all major aspects of the case study and dashboard.
Watch the video demoData was sourced from PDF files, web pages, text files, images, and Excel files from the most obscure corners of the internet.
Every data set in our repository was cleaned, checked for completeness and accuracy, and prioritized based on its relevance.
Diverse data sets were brought together through complex entity recognition, consistency checks, and error flagging.
Transform's geocoding and geo-boundary features made it easy to triangulate and compare locations across different data sets.
Users could drill down from national to district-level data, query at any level, and download the results to Excel.
Geospatial mapping made it easy to identify geographic clusters, patterns, and insights that would have been impossible to see in a table.
Teams at the Gates Foundation could find focus geographies with queries like “top 50 districts based on female-headed rural households”.
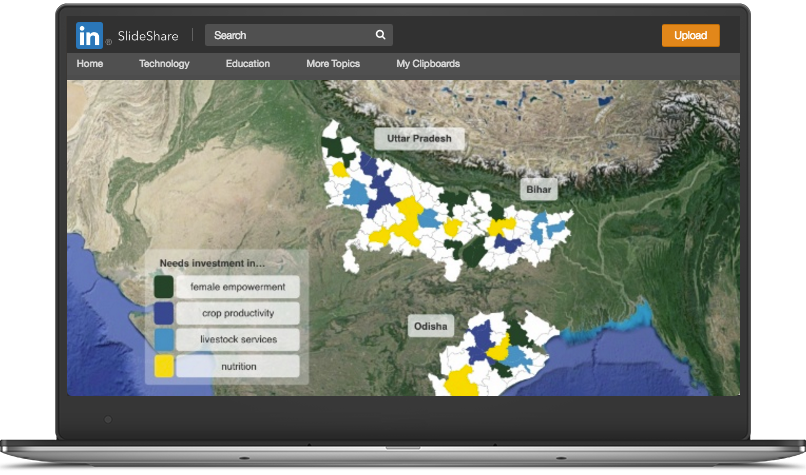
DECK
Want more information? Check out Slideshare for more details and the full story behind this case study.
Read more